Multiple Choice
For the following questions use the information in Table 10.1,which shows real GDP and potential real GDP for the years 2001-2010. 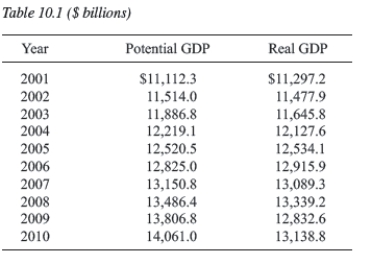
-According to the data in Table 10.1,about how much did short-run output fluctuations equal in 2001 and 2008,respectively?
A) -1.6%,1.1%
B) 1.7%;-1.1%
C) 101.6;147.2
D) -184.9;147.2
E) not enough information
Correct Answer:

Verified
Correct Answer:
Verified
Q13: According to The Economist, by 2006 _
Q17: _ peaked at the end of _.
Q21: The Great Recession began in _ and
Q59: What declined during the Great Recession?<br>A)unemployment rate<br>B)the
Q60: The _ was hastily designed to _
Q61: The sharp swing in core inflation in
Q63: What is an indicator of the extent
Q65: Consider the hypothetical bank balance sheet below
Q66: In the recent financial crisis,the banks' problems
Q68: In what year was the Federal Deposit