Multiple Choice
The following figure shows the daily three-month treasury yield in September 2008. Refer to the following figure when answering
Figure 10.1: Daily Three-Month Treasury Yield: September 2008 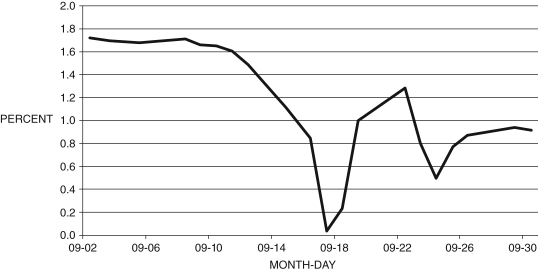 (Source: Federal Reserve Economic Data, St. Louis Federal Reserve)
-Consider the data in Figure 10.1. What does the data for mid-September in this figure suggest?
A) Increasing investor confidence in the effectiveness of TARP led to smaller purchases of U.S. treasuries.
B) There was a rapid movement of assets from treasuries to stocks.
C) In the aftermath of the collapse of Lehman Brothers investors fled to the safety of short-term treasuries.
D) Prices of gold declined in line with short-term treasury yields.
E) GM and Chrysler declared bankruptcy.
Correct Answer:

Verified
Correct Answer:
Verified
Q3: Loans, investments, and cash are on the
Q14: Between May 2004 and May 2006, the
Q16: A salve to the wounds of the
Q47: Between 1996 and 2006, housing prices averaged
Q56: Other recent financial crises occurred in:<br>A) Mexico
Q58: Refer to the following table when
Q73: The sharp swing in core inflation in
Q86: The acronym "CDO" stands for:<br>A) constant deficit
Q93: During the Great Recession, inflation was relatively
Q101: From a low of _ percent in