Multiple Choice
The following figure shows the daily three-month treasury yield in September 2008. Refer to the following figure when answering the following questions.
Figure 10.1: Daily Three-Month Treasury Yield: September 2008 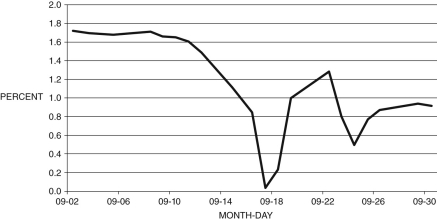
-Consider the data in Figure 10.1. What event precipitated the change in the yield in mid-September?
A) the expanded trade deficit with China
B) the election of Barack Obama
C) the bankruptcy of Lehman Brothers
D) the Greek fiscal crisis
E) the continuing Japanese recession
Correct Answer:

Verified
Correct Answer:
Verified
Q1: Refer to the following table when answering
Q2: Short-run output _ in the last quarter
Q3: Loans, investments, and cash are on the
Q5: When a bank experiences a bank run,
Q6: In the months following the collapse of
Q7: According to The Economist, in 2006, approximately
Q8: Briefly discuss the macroeconomic outcomes of the
Q9: During the Great Recession, the unemployment rate
Q10: In contrast to the dot-com stock market
Q11: After the Fed began to raise the