True/False
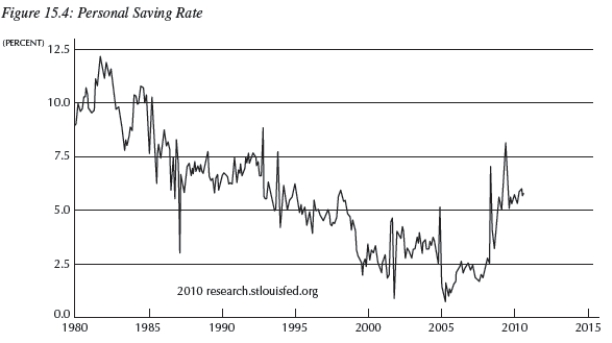
-Consider Figure 15.4 below,which shows the U.S.personal savings rate.A likely explanation for the rise in savings rates after 2009 is the continued strength in stock and housing markets.
Correct Answer:

Verified
Correct Answer:
Verified
Related Questions
Q8: If an individual has no access to
Q9: The <img src="https://d2lvgg3v3hfg70.cloudfront.net/TB4305/.jpg" alt="The In
Q10: The left-hand side of the Euler equation,
Q12: Consider two time periods: t and k.Which
Q14: Use Figure 15.2 to answer the following
Q15: Using the neoclassical model of consumption,an implication
Q16: One of the implications of the intertemporal
Q17: According to the neoclassical model _ over
Q44: Which of the following represents human wealth?<br>A)
Q68: If moving an extra unit of future