Multiple Choice
Assume that the number (in millions) of cellular telephone subscribers in the United States from 1996 through 2005 is given in the following table.Use a graphing utility to graph a line plot of the given data.Describe any trends that appear within the last four years. 
A) 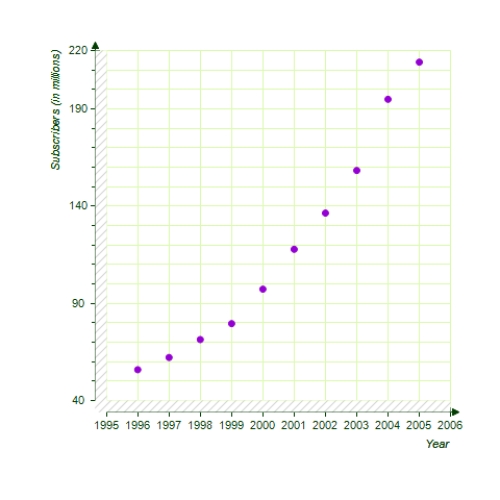
The number of subscribers appears to be increasing.
B) 
The number of subscribers appears to be decreasing.
C) 
The number of subscribers appears to be constant.
D) 
The number of subscribers appears to be decreasing
E) 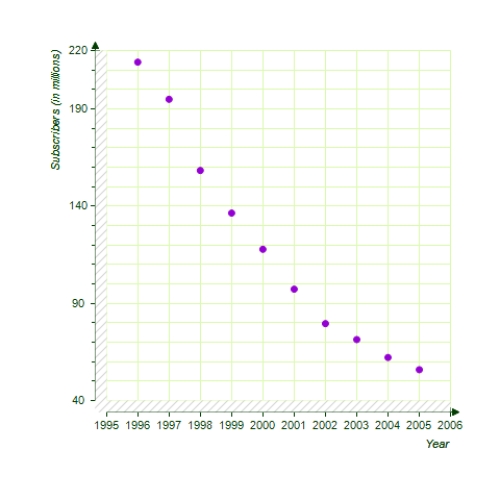
The number of subscribers appears to be increasing.
Correct Answer:

Verified
Correct Answer:
Verified
Q1: Complete the table and use the result
Q2: An airplane flying at an altitude of
Q3: Use the properties of logarithms to approximate
Q4: Analyze and sketch a graph of the
Q6: Sketch the graph of the function <img
Q7: Let <img src="https://d2lvgg3v3hfg70.cloudfront.net/TB1301/.jpg" alt="Let Determine
Q8: Find any vertical asymptotes for the given
Q9: Both a function and its derivative are
Q10: Find the points of intersection (if any)of
Q11: Solve the exponential equation.Give answers correct to