Multiple Choice
Assume that the number (in millions) of basic cable television subscribers in the United States from 1996 through 2005 is given in the following table.Use a graphing utility to graph a scatter plot of the given data.Describe any trends that appear within the last four years. 
A) 
The number of subscribers appears to be increasing.
B) 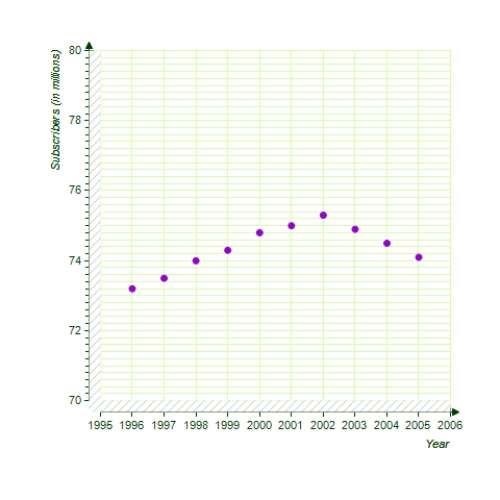
The number of subscribers appears to be decreasing.
C) 
The number of subscribers appears to be linearly decreasing.
D) 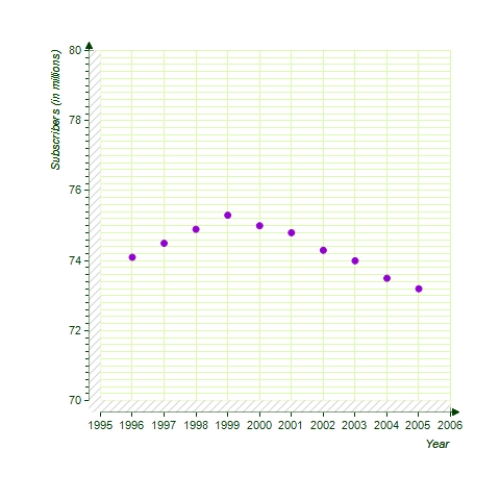
The number of subscribers appears to be decreasing
E) 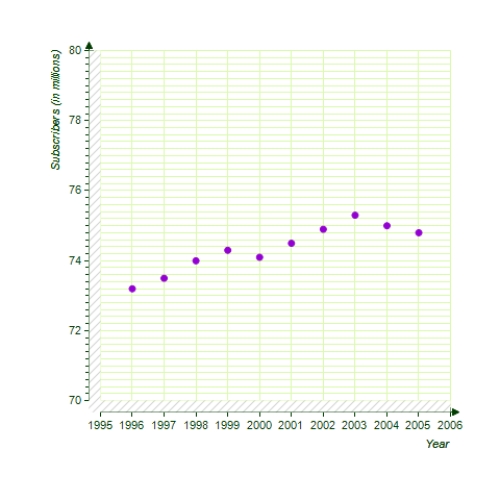
The number of subscribers appears to be linearly increasing.
Correct Answer:

Verified
Correct Answer:
Verified
Q218: Evaluate (if possible)the function at the given
Q219: A small business recaps and sells tires.The
Q220: Find the derivative of the function.
Q221: Find all relative extrema of the function
Q222: Find the x-values (if any)at which the
Q224: Find the second derivative of the function
Q225: A firm can produce 100 units per
Q226: Find the slope of the graph at
Q227: Find the derivative of the function <img
Q228: Find the distance between the points (-2,-5)and