Multiple Choice
Assume that the median sales prices of existing one family homes sold (in thousands of dollars) in the United States from 1990 through 2005 are as given in the following figure.Use the following figure to estimate the percent increase in the value of existing one-family homes from1999 to 2000.Round your answer to the nearest hundredth if necessary.
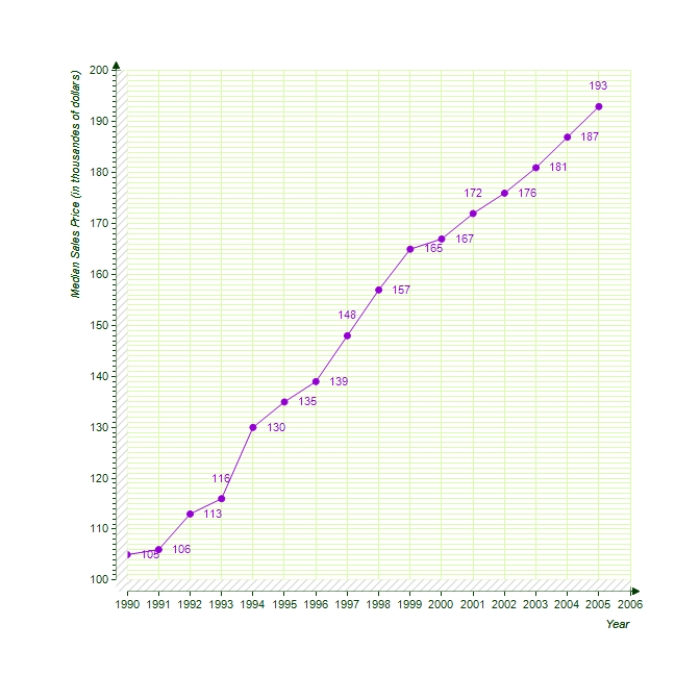
A) 1.2%
B) 201.21%
C) 101.21%
D) 98.8%
E) 1.21%
Correct Answer:

Verified
Correct Answer:
Verified
Q200: Sketch the graph of the function <img
Q201: Analytically determine the location of any vertical
Q202: Graph a function on the interval <img
Q203: Copy the points (-2,5),(3,-5),(-4,-1),(4,0),(2,-3)in the Cartesian plane.
Q204: A firm can produce 100 units per
Q206: The relationship between the number of decibels
Q207: Find the derivative of the function <img
Q208: Use a graphing utility to graph the
Q209: The cost C (in millions of dollars)for
Q210: Write an equation of the line that