Multiple Choice
The graph shows the number of visitors V to a national park in hundreds of thousands during a one-year period,where  represents January.Estimate the rate of change of V over the interval
  Round your answer to the nearest hundred thousand visitors per year.
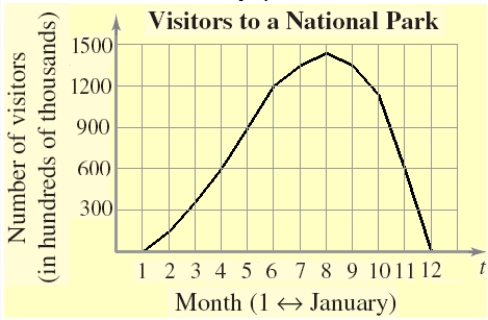
A) 187.5 hundred thousand visitors per year
B) 281.25 hundred thousand visitors per year
C) 225 hundred thousand visitors per year
D) 562.5 hundred thousand visitors per year
E) 1125 hundred thousand visitors per year
Correct Answer:

Verified
Correct Answer:
Verified
Q3: Find the slope of the tangent line
Q4: Identify a function f(x)that has the given
Q5: Find the second derivative for the function
Q6: Find the marginal cost for producing x
Q7: Find <img src="https://d2lvgg3v3hfg70.cloudfront.net/TB1301/.jpg" alt="Find implicitly
Q9: Find the derivative of the following function
Q10: A retail sporting goods store estimates that
Q11: A population of bacteria is introduced into
Q12: Assume that x and y are differentiable
Q13: Determine the point(s),(if any),at which the graph