Multiple Choice
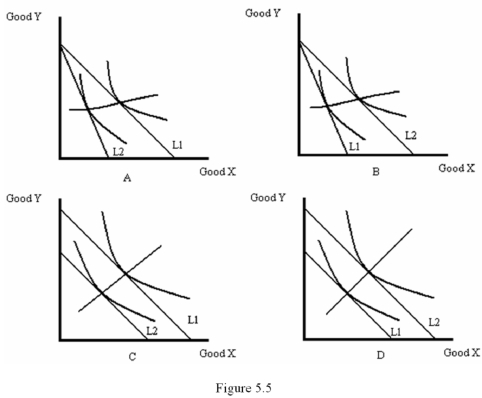
-Refer to Figure 5.5.Which diagram shows the price-consumption curve resulting from a decrease in the price of good X?
A) A
B) B
C) C
D) D
Correct Answer:

Verified
Correct Answer:
Verified
Related Questions
Q35: Whenever a consumer purchases good X but
Q37: <img src="https://d2lvgg3v3hfg70.cloudfront.net/TB1639/.jpg" alt=" -Refer to Table
Q38: Boundary solutions arise when<br>A) A good provides
Q39: <img src="https://d2lvgg3v3hfg70.cloudfront.net/TB1639/.jpg" alt=" -When the price
Q41: If an increase in the price of
Q44: In Canada provincial regulatory boards set tiered
Q45: If two goods are substitutes,then an increase
Q46: A consumer's budget constraint is<br>A) A positively
Q47: If a good is normal,then the Engel
Q74: Suppose that an individual consumes just hamburgers