Multiple Choice
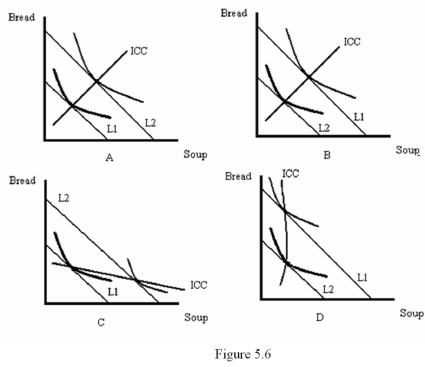
-Refer to Figure 5.6.Which diagram shows a decrease in income with bread being normal and soup being inferior?
A) A
B) B
C) C
D) D
Correct Answer:

Verified
Correct Answer:
Verified
Related Questions
Q4: Using carefully-labeled graphs,explain how an individual demand
Q25: Suppose that steak is a normal good
Q34: Suppose a consumer buy books and DVDs.The
Q45: If two goods are substitutes,then an increase
Q46: A consumer's budget constraint is<br>A) A positively
Q47: If a good is normal,then the Engel
Q49: The curve that shows how the best
Q53: Nicole's income is $1,000 per month.She spends
Q54: An affordable consumption bundle is an interior
Q55: If the income-consumption path slopes upward,then<br>A) Both