Multiple Choice
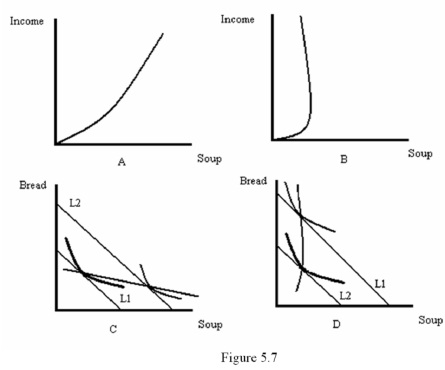
-Refer to Figure 5.7.Which diagram best represents an income-consumption curve where soup is a normal good?
A) A
B) B
C) C
D) D
Correct Answer:

Verified
Correct Answer:
Verified
Related Questions
Q43: Which of the following statements is true?<br>A)
Q57: <img src="https://d2lvgg3v3hfg70.cloudfront.net/TB1639/.jpg" alt=" -Refer to Figure
Q58: If everyone in an economy buys and
Q59: Mike's income is $450 per month.He spends
Q60: The price of bread is $1.50 per
Q63: When the government provides food stamps to
Q65: Suppose a consumer buys pizza (P)and soft
Q65: Suppose that books are measured on the
Q66: <img src="https://d2lvgg3v3hfg70.cloudfront.net/TB1639/.jpg" alt=" -Refer to Figure
Q67: <img src="https://d2lvgg3v3hfg70.cloudfront.net/TB1639/.jpg" alt=" -Refer to Figure