Multiple Choice
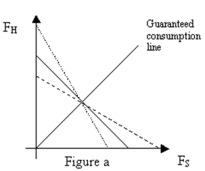
-Refer to Figure a.Assuming the bold line in the graph above is a constant expected consumption line where  ,which constant expected consumption line reflects an increase in
  ?
?
A) Dotted line
B) Dashed line
C) An increase in does not result in an change in the expected consumption line
D) A change in results in a parallel shift in the expected consumption line, so neither the red or green line reflects this change
Correct Answer:

Verified
Correct Answer:
Verified
Q1: Dean's expected payoff from investing in Pretty
Q2: Suppose Brandon's indifference curves are defined as
Q4: Given the information in problem 2 above,the
Q4: Explain the relationship between the correlation of
Q6: What is Brandon's expected utility given the
Q7: Brandon's certainty equivalent given the information in
Q8: A person is risk loving if<br>A) For
Q9: <img src="https://d2lvgg3v3hfg70.cloudfront.net/TB1639/.jpg" alt=" -Refer to Figures
Q11: Suppose Dean has $500 and he wants
Q42: Suppose Alice is deciding whether or not