Multiple Choice
Narrbegin Exhibit 5.3 Supply and demand curves for good X 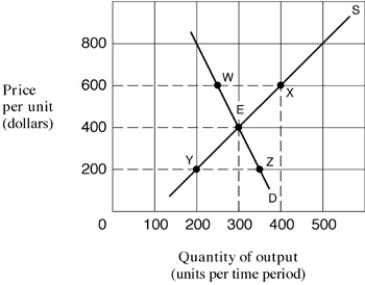
-As shown in Exhibit 5.3, the price elasticity of supply for good X between points E and X is:
A) 0.125.
B) 1
C) 1.352
D) .714
Correct Answer:

Verified
Correct Answer:
Verified
Q3: The price elasticity of demand coefficient for
Q49: Narrbegin Exhibit 5.1 Demand curves <img src="https://d2lvgg3v3hfg70.cloudfront.net/TB2058/.jpg"
Q50: Narrbegin Exhibit 5.1 Demand curves <img src="https://d2lvgg3v3hfg70.cloudfront.net/TB2058/.jpg"
Q52: The short-run price elasticity of demand for
Q53: The number of satellite dishes increased by
Q55: Any downward-sloping straight line demand curve displays:<br>A)
Q56: Using the midpoint formula, what would be
Q57: The income elasticity of demand for shoes
Q58: The straight line demand curve represents the
Q59: Along a straight-line demand curve, the elasticity