Multiple Choice
The table below shows the velocities, in feet per second, of a ball that is thrown horizontally from the top of a 50 foot building and the distances, in feet, that it lands from the base of the building.Compute the linear regression equation for these data. 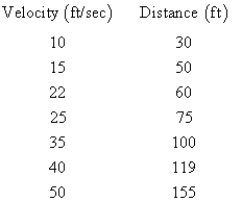
A) 
B) 
C) 
D) 
E) 
Correct Answer:

Verified
Correct Answer:
Verified
Q50: A pebble is dropped into a calm
Q51: Sketch the graph of the equation below.
Q52: Sketch the graph of the function. <img
Q53: Sketch the graph of the function. <img
Q54: Estimate the slope of the line. <img
Q56: Determine the domain of <img src="https://d2lvgg3v3hfg70.cloudfront.net/TB2036/.jpg" alt="Determine
Q57: The population <img src="https://d2lvgg3v3hfg70.cloudfront.net/TB2036/.jpg" alt="The population
Q58: Find the slope of the line that
Q59: Plot the points below whose coordinates are
Q60: Given <img src="https://d2lvgg3v3hfg70.cloudfront.net/TB2036/.jpg" alt="Given find