Multiple Choice
The U.S.annual gross domestic product G (in billions of dollars) from 1985 through 2009 can be modeled by 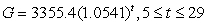 where
where  represents the year, with
  corresponding to 1985 (Source: U.S.Bureau of Economics Analysis) (a) Use a graphing utility to graph G for the years 1985 through 2009.
(b) Use the graph from part (a) to estimate the gross domestic product in 1990,2000 and 2009.
A) 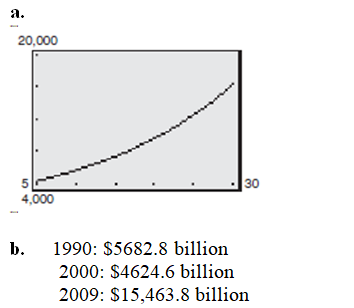
B) 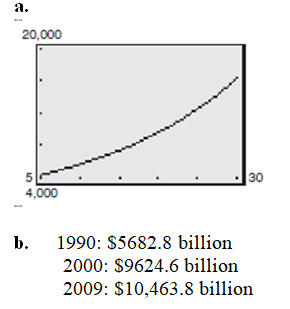
C) 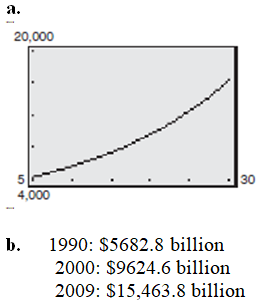
D) 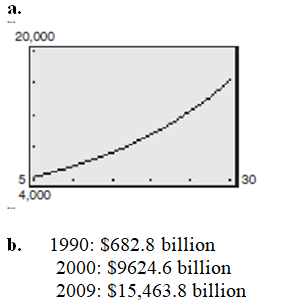
E) 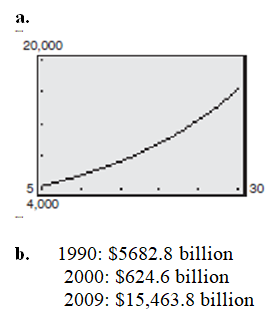
Correct Answer:

Verified
Correct Answer:
Verified
Q1: The approximate lengths and diameters (in inches)
Q2: Match the function below with its graph.
Q3: Estimate the percentage of radioactive material that
Q4: Write the exponential equation <img src="https://d2lvgg3v3hfg70.cloudfront.net/TB2036/.jpg" alt="Write
Q6: Find the inverse function informally <img src="https://d2lvgg3v3hfg70.cloudfront.net/TB2036/.jpg"
Q7: Solve the exponential equation algebraically.Approximate the result
Q8: Condense the expression <img src="https://d2lvgg3v3hfg70.cloudfront.net/TB2036/.jpg" alt="Condense the
Q9: Find the inverse function of the function
Q10: Solve <img src="https://d2lvgg3v3hfg70.cloudfront.net/TB2036/.jpg" alt="Solve for
Q11: Find the exact value of <img src="https://d2lvgg3v3hfg70.cloudfront.net/TB2036/.jpg"