Multiple Choice
An instructor made a frequency table of the scores his students got on a test 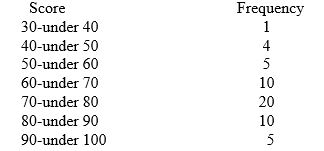 The midpoint of the last class interval is _________.
A) 90
B) 5
C) 95
D) 100
E) 50
Correct Answer:

Verified
Correct Answer:
Verified
Related Questions
Q8: Consider the relative frequency distribution given below:
Q12: The number of phone calls arriving at
Q14: Consider the following frequency distribution: <img src="https://d2lvgg3v3hfg70.cloudfront.net/TB6468/.jpg"
Q15: The staff of Ms.Tamara Hill,VP of Technical
Q18: Consider the relative frequency distribution given below:
Q19: A histogram can be described as a
Q46: In contrast to quantitative data graphs that
Q69: A scatter plot shows how the numbers
Q72: A scatter plot is useful for examining
Q95: Dot Plots are mainly used to display