Multiple Choice
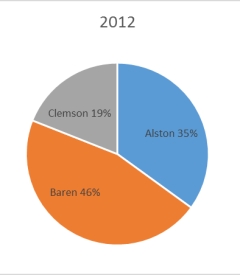
The 2010 and 2012 market share data of the three competitors (Alston,Baren,and Clemson) in an oligopolistic industry are presented in the following pie charts. Total sales for this industry were $1.5 billion in 2010 and $1.8 billion in 2012.Clemson's sales in 2010 were ___________. 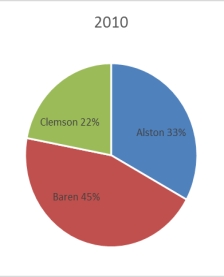
A) $342 million
B) $630 million
C) $675 million
D) $828 million
E) $928 million
Correct Answer:

Verified
Correct Answer:
Verified
Q82: For a company in gardening supplies business,the
Q83: An instructor made a frequency table of
Q84: The number of phone calls arriving at
Q85: The following is a bar chart of
Q86: The following pie chart shows the market
Q87: The staffs of the accounting and the
Q89: Each day,the office staff at Oasis Quick
Q90: Abel Alonzo,Director of Human Resources,is exploring employee
Q91: The staff of Ms.Tamara Hill,VP of Technical
Q92: Consider the following frequency distribution: <img src="https://d2lvgg3v3hfg70.cloudfront.net/TB6468/.jpg"