Multiple Choice
The following graphic of PCB Failures is a _____________. 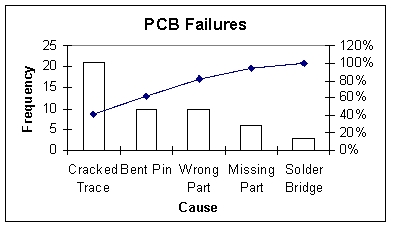
A) Scatter Plot
B) Pareto Chart
C) Pie Chart
D) Cumulative Histogram Chart
E) Line diagram
Correct Answer:

Verified
Correct Answer:
Verified
Related Questions
Q22: The class mark is the _, and
Q42: Each day,the office staff at Oasis Quick
Q43: The following represent the ages of students
Q44: Suppose a market survey of 200 consumers
Q45: One rule that must always be followed
Q46: Abel Alonzo,Director of Human Resources,is exploring employee
Q48: Consider the relative frequency distribution given below:
Q49: The 2010 and 2012 market share data
Q50: Each day,the manager at Jamie's Auto Care
Q52: In a histogram,the tallest bar represents the