Multiple Choice
The following graphic of residential housing data (selling price and size in square feet) indicates _____________. 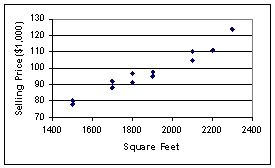
A) an inverse relation between the two variables
B) no relation between the two variables
C) a direct relation between the two variables
D) a negative exponential relation between the two variables
E) a sinusoidal relationship between the two variables
Correct Answer:

Verified
Correct Answer:
Verified
Q4: A recent survey of U.S.automobile owners showed
Q5: Scott Brim,Chief Financial Officer of Space Mall,Inc.,wants
Q6: A summary of data in which raw
Q8: Consider the relative frequency distribution given below:
Q46: In contrast to quantitative data graphs that
Q52: Given two class intervals and their respective
Q56: If the individual class frequency is divided
Q72: A scatter plot is useful for examining
Q77: Your company is doing market research to
Q95: Dot Plots are mainly used to display