Multiple Choice
The United Nations Development Programme website provides comparative data by country on key metrics,such metrics as life expectancy over time.The chart below shows data on life expectancy over time in the United States. 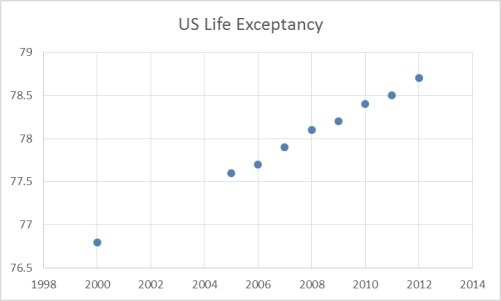 Which of the following statements are not true based on the scatterplot of U.S.Life Expectancy over time?
A) The life expectancy in the U.S.is increasing over time.
B) U.S.citizens lived fewer years in 2010 than they did in in 2008.
C) The scatterplot shows an increasing trend in life expectancy in the U.S.
D) Based on the scatterplot,one can assume the life expectancy in 2014 will be higher than 78 years.
E) All of these statements are true.
Correct Answer:

Verified
Correct Answer:
Verified
Q3: The cumulative frequency for a class is
Q22: The class mark is the _, and
Q49: The 2010 and 2012 market share data
Q50: Each day,the manager at Jamie's Auto Care
Q52: In a histogram,the tallest bar represents the
Q57: The following class intervals for a frequency
Q58: According to the following graphic,the most common
Q59: One advantage of a stem and leaf
Q59: The staff of Mr.Wayne Wertz,VP of Operations
Q113: Consider a scatterplot showing the relationship between