Multiple Choice
The United Nations Development Programme website provides comparative data by country on key metrics.Two such metrics are life expectancy and expenditures on health as a percent of GDP.The table below shows data on life expectancy and health expenditures in the United States.  Which of the following scatterplots best depicts the relationship between life expectancy and
Expenditures on health as a percent of GDP?
A) 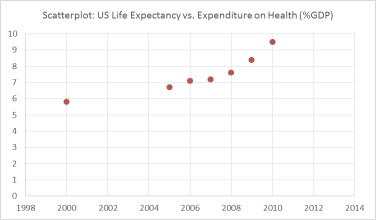
B) 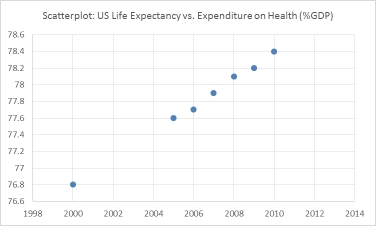
C) 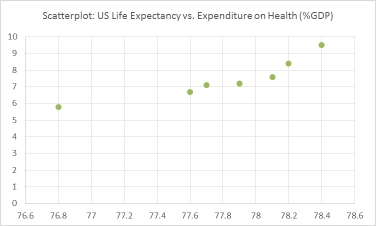
D) 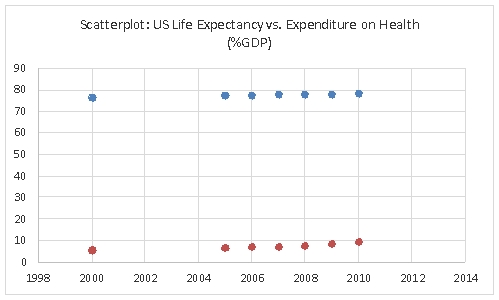
Correct Answer:

Verified
Correct Answer:
Verified
Q24: In a frequency distribution, the first class
Q27: Consider the following stem and leaf plot:
Q28: The staff of Mr.Wayne Wertz,VP of Operations
Q30: The staff of Mr.Wayne Wertz,VP of Operations
Q31: The 2010 and 2012 market share data
Q33: Pinky Bauer,Chief Financial Officer of Harrison Haulers,Inc.,suspects
Q34: Your company is doing market research to
Q35: The following graphic of cigarettes smoked (sold)per
Q36: Consider the following stem and leaf plot:
Q37: Each day,the office staff at Oasis Quick