Multiple Choice
The following graph is a binomial distribution with n = 6. 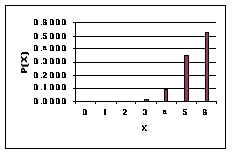 This graph reveals that ____________.
A) p > 0.5
B) p = 1.0
C) p = 0
D) p < 0.5
E) p = 1.5
Correct Answer:

Verified
Correct Answer:
Verified
Related Questions
Q1: Suppose that the number of calls coming
Q14: For the Poisson distribution the mean represents
Q17: The number of visitors to a website
Q29: From recent polls about customer satisfaction, you
Q35: The mean or the expected value of
Q46: If x is a binomial random variable
Q54: If x is a binomial random variable
Q68: A hypergeometric distribution applies to experiments in
Q74: A Poisson distribution is characterized by one
Q82: For the Poisson distribution the mean and