Multiple Choice
According to the following graphic,X and Y have _________. 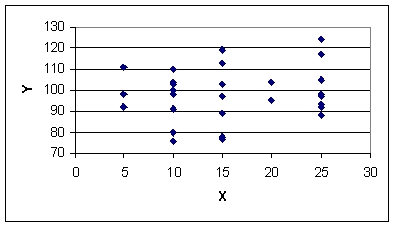
A) strong negative correlation
B) virtually no correlation
C) strong positive correlation
D) moderate negative correlation
E) weak negative correlation
Correct Answer:

Verified
Correct Answer:
Verified
Related Questions
Q2: The assumptions underlying simple regression analysis include
Q5: A standard deviation of the error of
Q14: A simple regression model for 10 pair
Q83: The total of the squared residuals is
Q88: The coefficient of correlation in a simple
Q90: The variability in the estimated slope is
Q95: Abby Kratz,a market specialist at the market
Q97: Correlation is a measure of the degree
Q102: <img src="https://d2lvgg3v3hfg70.cloudfront.net/TB6468/.jpg" alt=" -In the regression
Q104: A manager wishes to predict the annual