Multiple Choice
The following residuals plot indicates _______________. 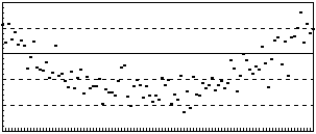
A) a nonlinear relation
B) a nonconstant error variance
C) the simple regression assumptions are met
D) the sample is biased
E) a random sample
Correct Answer:

Verified
Correct Answer:
Verified
Related Questions
Q28: The process of constructing a mathematical model
Q46: A simple regression model resulted in a
Q47: The standard error of the estimate,denoted s<sub>e</sub>,is
Q48: A quality manager is developing a regression
Q49: The coefficient of determination is the proportion
Q51: In the simple regression model,y = 21
Q53: A cost accountant is developing a regression
Q54: To determine whether the overall regression model
Q70: In a simple regression the coefficient of
Q107: The proportion of variability of the dependent