Multiple Choice
The following graph of time-series data suggests a _______________ trend. 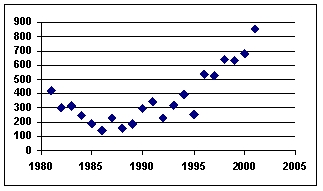
A) linear
B) quadratic
C) cosine
D) tangential
E) flat
Correct Answer:

Verified
Correct Answer:
Verified
Related Questions
Q2: One of the main techniques for isolating
Q2: A weighted aggregate price index where the
Q3: The table below shows the prices in
Q10: The table below shows the prices in
Q11: One of the ways to overcome the
Q12: Analysis of data for an autoregressive forecasting
Q16: If the Year<sub>t</sub> Quarter<sub>q</sub> actual value is
Q47: In statistics, the Winters' Three Parameter statistic
Q79: If the trend equation is linear in
Q92: Naïve forecasting models have no useful applications