Multiple Choice
The following graph of a time-series data suggests a _______________ trend. 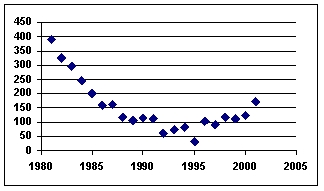
A) linear
B) tangential
C) cosine
D) quadratic
E) flat
Correct Answer:

Verified
Correct Answer:
Verified
Related Questions
Q12: If autocorrelation occurs in regression analysis, then
Q46: Use of a smoothing constant value less
Q63: Two popular general categories of smoothing techniques
Q64: A time series analysis was performed to
Q65: Analysis of data for an autoregressive forecasting
Q66: Fitting a linear trend to 36 monthly
Q69: Jim Royo,manager of Billings Building Supply
Q70: A time series with forecast values is
Q73: Using 2011 as the base year,the 2010
Q99: An exponential smoothing technique in which the