Multiple Choice
The following graph of a time-series data suggests a _______________ trend. 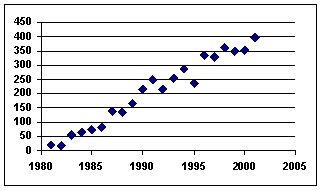
A) linear
B) quadratic
C) cosine
D) tangential
E) flat
Correct Answer:

Verified
Correct Answer:
Verified
Related Questions
Q54: One of the ways to overcome the
Q60: The high and low values of the
Q64: One of the main techniques for isolating
Q78: Time-series data are data gathered on a
Q86: The city golf course is interested in
Q87: Using 2011 as the base year,the 2010
Q89: Fitting a linear trend to 36 monthly
Q91: A time series with forecast values is
Q92: Jim Royo,manager of Billings Building Supply
Q95: Autocorrelation in a regression forecasting model can