Multiple Choice
In the below graph,which shows the relationship among components of quality cost,Line "B" depicts: 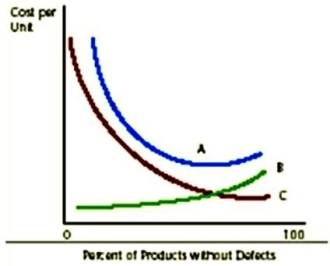
A) total quality costs.
B) external failure quality cost.
C) voluntary quality costs.
D) internal failure quality costs.
Correct Answer:

Verified
Correct Answer:
Verified
Q116: Activity-based costing does not use volume-based cost
Q117: Traditional cost systems usually allocate overhead to
Q118: Costs incurred to avoid nonconforming products are:<br>A)
Q119: Pro Tool Company expects to produce
Q120: Depreciation on a manufacturing facility is an
Q122: Which of the following is an appraisal
Q123: The objective of using the following graph
Q124: Franklin Manufacturing manufactures two models of
Q125: Mason Company is planning to introduce an
Q126: Indicate whether each of the following statements