Multiple Choice
Consider the following cost-volume-profit graph: 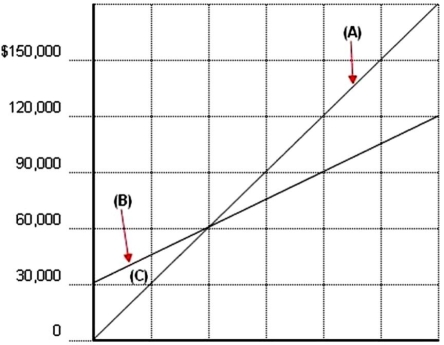 The area designated by the letter (C) represents which of the following?
A) Profit area
B) Loss area
C) Break-even area
D) Fixed cost area
Correct Answer:

Verified
Correct Answer:
Verified
Q98: How would a company use target pricing
Q99: The following information is for a product
Q100: Chicago Company incurs annual fixed costs of
Q101: The Parsons Company makes and sells
Q102: When computing the break-even point in units,a
Q104: Consider the following cost-volume-profit graph: <img src="https://d2lvgg3v3hfg70.cloudfront.net/TB6523/.jpg"
Q105: Sensitivity analysis acknowledges that profitability is often
Q106: How can the contribution margin ratio be
Q107: Select the incorrect break-even equation from the
Q108: The Victor Company sells two products.The