Multiple Choice
Consider the following cost-volume-profit graph: 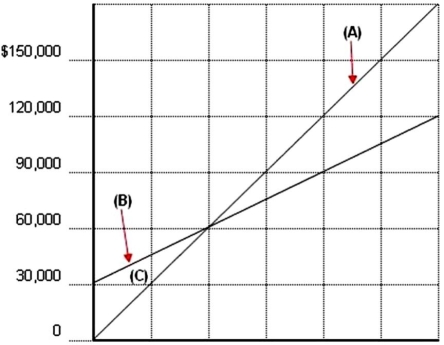 What is the approximate amount of fixed costs in this organization?
A) $0
B) $25,000
C) $60,000
D) $30,000
Correct Answer:

Verified
Correct Answer:
Verified
Q104: Consider the following cost-volume-profit graph: <img src="https://d2lvgg3v3hfg70.cloudfront.net/TB6523/.jpg"
Q105: Sensitivity analysis acknowledges that profitability is often
Q106: How can the contribution margin ratio be
Q107: Select the incorrect break-even equation from the
Q108: The Victor Company sells two products.The
Q110: To find the break-even point for a
Q111: Broadway Company produces and sells two
Q112: Bruce Company recently reduced its advertising
Q113: Martin Company currently produces and sells 40,000
Q114: How is weighted average contribution margin calculated,and