Multiple Choice
In the graph below,which depicts the relationship between units produced and total cost,the dotted line depicts which type of total cost? 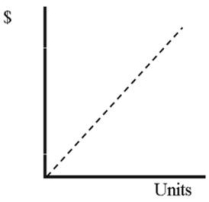
A) Variable cost
B) Fixed cost
C) Mixed cost
D) None of these
Correct Answer:

Verified
Correct Answer:
Verified
Related Questions
Q128: The variable cost per unit increases in
Q129: How does total fixed cost behave when
Q130: The magnitude of operating leverage for Perkins
Q131: Quick Change and Fast Change are competing
Q132: A cost that contains both fixed and
Q134: Descriptions of cost behavior as fixed or
Q135: Variable costs will become fixed outside the
Q136: Assume that wages expense is a variable
Q137: Grant Company and Lee Company compete
Q138: The following income statements are provided