Multiple Choice
In the graph below,which depicts the relationship between units produced and unit cost,the dotted line depicts which type of cost per unit? 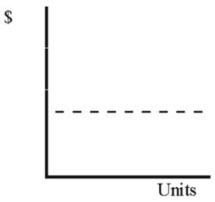
A) Variable cost
B) Fixed cost
C) Mixed cost
D) None of these
Correct Answer:

Verified
Correct Answer:
Verified
Related Questions
Q79: Select the incorrect statement regarding the relationship
Q80: The activity base selected determines whether a
Q81: Based on the following cost data,items
Q82: The following income statement is provided
Q83: Based on the income statements of
Q85: The contribution margin format income statement classifies
Q86: Which of the following equations can be
Q87: Complete the following table to indicate
Q88: Risk refers to the possibility that sacrifices
Q89: One way that computing an average cost