Multiple Choice
In the graph below,which depicts the relationship between units produced and total cost,the dotted line depicts which type of total cost? 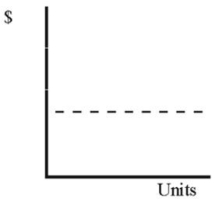
A) Variable cost
B) Fixed cost
C) Mixed cost
D) None of these
Correct Answer:

Verified
Correct Answer:
Verified
Related Questions
Q134: Descriptions of cost behavior as fixed or
Q135: Variable costs will become fixed outside the
Q136: Assume that wages expense is a variable
Q137: Grant Company and Lee Company compete
Q138: The following income statements are provided
Q140: Executive management at Ballard Books is very
Q141: Wu Company incurred $40,000 of fixed cost
Q142: Pickard Company pays its sales staff a
Q143: The manager of Kenton Company stated that
Q144: Select the incorrect statement regarding fixed and