Multiple Choice
Figure 2-4 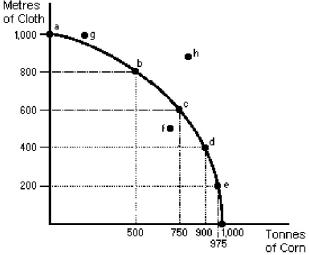
-Between c and b in Figure 2-4,the opportunity cost of another tonne of corn is (on average)
A) 1 metre of cloth.
B) 100/125 metres of cloth.
C) 100/250 metres of cloth.
D) 1) 25 metres of cloth.
Correct Answer:

Verified
Correct Answer:
Verified
Q127: Capital goods<br>A)are a special type of consumption
Q128: Specialization according to the comparative advantage principle
Q129: When applied to an economic system,the term
Q130: A straight-line PPC would indicate that there
Q131: The benefits from specialization and trade are
Q132: The opportunity cost of producing more capital
Q133: Consider the following production possibilities table for
Q134: A production possibilities curve bowed outward is
Q136: Figure 2-2 <img src="https://d2lvgg3v3hfg70.cloudfront.net/TB4981/.jpg" alt="Figure 2-2
Q137: The more goods and services a society