Multiple Choice
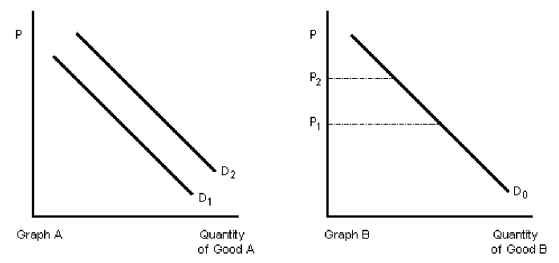
Figure 3-1 
-In Figure 3-1,if both A and B are normal goods,the effect of an increase in income is best shown by the
A) shift of D₂ to D₁ in Graph A.
B) movement along D₀ from P₂ to P₁ in Graph B.
C) movement along D₀ from P₁ to P₂ in Graph B.
D) shift of D₁ to D₂ in Graph A.
Correct Answer:

Verified
Correct Answer:
Verified
Q103: The market demand curve for a commodity
Q104: If a particular good or service is
Q105: Table 3-1<br> <img src="https://d2lvgg3v3hfg70.cloudfront.net/TB4981/.jpg" alt="Table 3-1
Q106: Explain the relationship between the money price
Q107: Figure 3-4 <img src="https://d2lvgg3v3hfg70.cloudfront.net/TB4981/.jpg" alt="Figure 3-4
Q109: Table 3-1<br> <img src="https://d2lvgg3v3hfg70.cloudfront.net/TB4981/.jpg" alt="Table 3-1
Q110: Explain why there normally would be a
Q111: The excess supply of spaces for potential
Q112: In determining the demand for a good,economists<br>A)hold
Q113: We observe that people buy less steak