Multiple Choice
Figure 3-4 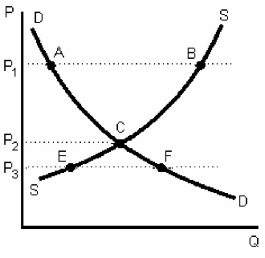
-In Figure 3-4,a surplus is shown as the distance between which two points?
A) C and B
B) A and C
C) E and F
D) B and A
Correct Answer:

Verified
Correct Answer:
Verified
Related Questions
Q57: Briefly explain the determinants of a good's
Q58: The demand for a coffee _ when
Q59: Which of the following is NOT a
Q60: Other things constant,quantity supplied of a product
Q61: If two goods are substitutes for one
Q63: A large increase in the price of
Q64: Other things constant,the only way to move
Q65: A demand schedule holds<br>A)product price constant.<br>B)equilibrium constant.<br>C)product
Q66: If more buyers come into the market
Q67: If the price of butter increases,the demand