Multiple Choice
Figure 3-5 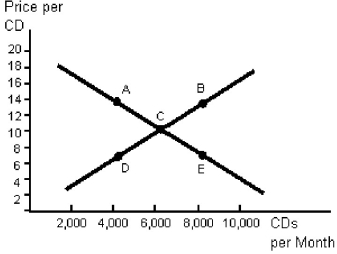
-According to Figure 3-5,market equilibrium for CDs is at point
A) D)
B) B)
C) E)
D) C)
Correct Answer:

Verified
Correct Answer:
Verified
Related Questions
Q78: Explain how a market demand curve can
Q79: The market supply curve is found by<br>A)surveys
Q80: Table 3-1<br> <img src="https://d2lvgg3v3hfg70.cloudfront.net/TB4981/.jpg" alt="Table 3-1
Q81: The "other things" constant when we examine
Q82: In 2007,the price of gasoline in Canada
Q84: Using a graph to help you,explain the
Q85: Explain what inferior goods are and give
Q86: Figure 3-5 <img src="https://d2lvgg3v3hfg70.cloudfront.net/TB4981/.jpg" alt="Figure 3-5
Q87: The quantity supplied of a particular good
Q88: The relative price of a good is