Multiple Choice
Figure 3-6 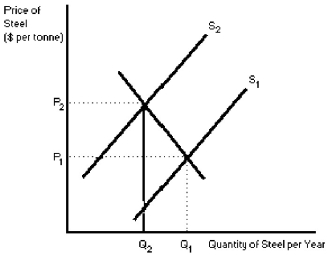
-In Figure 3-6 the shift from S₂ to S₁ would be
A) a decrease in supply.
B) an increase in supply.
C) an increase in quantity supplied.
D) a decrease in quantity supplied.
Correct Answer:

Verified
Correct Answer:
Verified
Related Questions
Q91: Suppose that the demand curve for apples
Q92: Bill quits his job to pursue an
Q93: Which of the following is most likely
Q94: Table 3-4<br> <img src="https://d2lvgg3v3hfg70.cloudfront.net/TB4981/.jpg" alt="Table 3-4
Q95: There is an increase in the quantity
Q97: Using a graph to help you,explain the
Q98: An increase in perks offered to potential
Q99: Not long ago the papers announced that
Q100: Using graphs,explain the difference between a change
Q101: If macaroni and cheese is an inferior