Multiple Choice
Figure 6-1 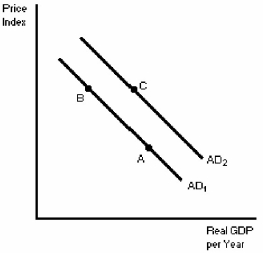
-In Figure 6-1,a movement from point B to point A can be explained by
A) an increase in the real value of cash balances.
B) a decrease in the real value of cash balances.
C) the decrease in interest rates.
D) the increase in exports to the foreign sector.
Correct Answer:

Verified
Correct Answer:
Verified
Q17: Persistent inflation in an economy is only
Q18: According to the interest rate effect,an increase
Q19: Which of the following would cause aggregate
Q20: Explain how aggregate demand fluctuations create price
Q21: The aggregate demand curve plots<br>A)desired expenditures against
Q23: The aggregate demand curve shifts to the
Q24: Compare and contrast the demand and supply
Q25: An aggregate demand curve<br>A)shifts to the right
Q26: In the long run,the level of production
Q27: When the real interest rate rises,<br>A)AD shifts