Multiple Choice
Figure 6-1 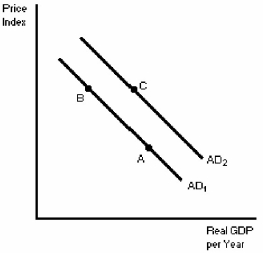
-In Figure 6-1,a movement from point B to point C could be explained by
A) an increase in the price level.
B) a decrease in the price level.
C) the start of a short-term war.
D) the real-balance effect.
Correct Answer:

Verified
Correct Answer:
Verified
Q33: If other factors are held constant,an increase
Q34: An indirect effect because price level increases
Q35: An individual holds $20 000 in an
Q36: Holding nominal money balances constant,a decrease in
Q37: The aggregate demand curve shows that,if other
Q39: The aggregate production function<br>A)measure aggregate demand.<br>B)measure aggregate
Q40: Describe what happens in the economy when
Q42: The long-run aggregate supply curve<br>A)is horizontal.<br>B)indicates the
Q43: Which of the following is a factor
Q226: Economic growth can be thought of as<br>A)