Multiple Choice
Figure 8-1 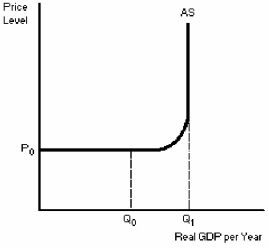
-According to Figure 8-1,an increase in aggregate demand between real GDP levels Q₀ and Q₁
A) would most likely result in some inflation.
B) would not increase output since the economy is already working at full capacity.
C) would have no effect on the price level.
D) would cause price levels to fall.
Correct Answer:

Verified
Correct Answer:
Verified
Q94: If the Canadian dollar becomes weaker in
Q95: If the Canadian dollar becomes stronger in
Q96: Suppose that the sras decreases while AD
Q97: The long-run aggregate supply curve will shift
Q98: The relationship between the price level and
Q100: The short-run aggregate supply curve represents the
Q101: Figure 8-5 <img src="https://d2lvgg3v3hfg70.cloudfront.net/TB4981/.jpg" alt="Figure 8-5
Q102: What is measured on the vertical axis
Q103: As the price level increases,the short-run aggregate
Q104: One possible result of a fall in