Multiple Choice
Figure 8-1 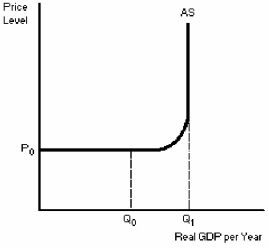
-According to Figure 8-1,________ in aggregate demand between real GDP levels Q₀ and Q₁ would most likely result in some inflation.
A) an increase
B) a decrease
C) a lateral movement
D) movement
Correct Answer:

Verified
Correct Answer:
Verified
Q40: Economic growth will be associated with a
Q73: Figure 8-1 <img src="https://d2lvgg3v3hfg70.cloudfront.net/TB4981/.jpg" alt="Figure 8-1
Q75: Figure 8-4 <img src="https://d2lvgg3v3hfg70.cloudfront.net/TB4981/.jpg" alt="Figure 8-4
Q76: Whenever the general level of prices rises
Q77: The _ between the short-run aggregate supply
Q79: As the _ decreases,the short-run aggregate supply
Q80: A long run equilibrium occurs at the
Q81: Figure 8-4 <img src="https://d2lvgg3v3hfg70.cloudfront.net/TB4981/.jpg" alt="Figure 8-4
Q82: If the price level kept increasing,the _
Q273: The long-run aggregate supply curve will shift