Multiple Choice
Figure 8-2 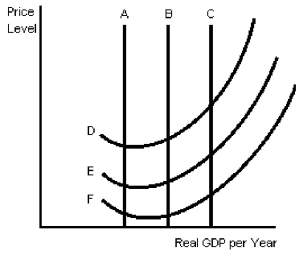
-In Figure 8-2,assume that A is the current long-run aggregate supply curve and that E is the current short-run aggregate supply curve.If there were a discovery of large oil fields in Manitoba,where no one thought oil fields existed,then we could expect the long-run aggregate supply curve and the short-run aggregate supply curve to
A) remain B and E.
B) move to A and D.
C) move to B and F.
D) move to A and F.
Correct Answer:

Verified
Correct Answer:
Verified
Q60: The positive relationship between the _ function
Q61: The short-run aggregate supply function plots<br>A)planned expenditures
Q62: Figure 8-3 <img src="https://d2lvgg3v3hfg70.cloudfront.net/TB4981/.jpg" alt="Figure 8-3
Q63: The short-run aggregate supply function plots _
Q66: If there are continual decreases in aggregate
Q67: Explain what is meant by cost-push inflation?
Q68: The _ function plots planned production against
Q69: Derive the SRAS and explain fully.Once done,discuss
Q70: If the price level kept decreasing,the short-run
Q357: An unexpected event that causes the aggregate