Multiple Choice
Science Literacy Refer to the graph below to answer the following questions. 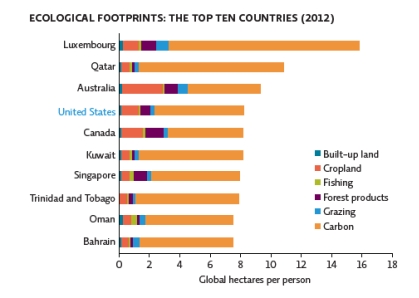
-According to the data in the graph,which country would be most affected by a severe drought?
A) Luxembourg
B) Australia
C) Canada
D) Kuwait
E) Oman
Correct Answer:

Verified
Correct Answer:
Verified
Related Questions
Q50: If a forest produces 200 trees each
Q51: How many billions of dollars per year
Q52: One area where traditional economics differs from
Q53: Which statement is correct?<br>A)Traditional economics discounts short-term
Q54: Sustainable use of forests allows us to
Q56: Refer to Infographic 1.Why is it useful
Q57: What are the internal and external costs
Q58: What is meant by the term "sustainable"?<br>A)capable
Q59: By ignoring the _,economies create a false
Q60: Refer to Infographic 5.Why is it important