Multiple Choice
Science Literacy Use the following graphs to answer the next questions. 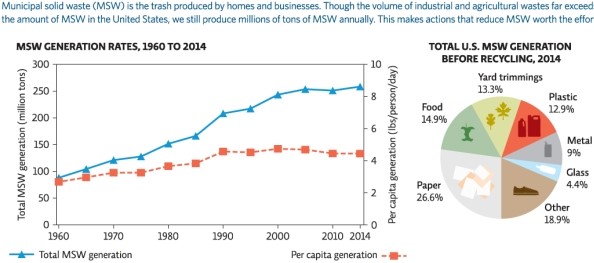
-What was the per capita generation of MSW generation in 1970 (lbs/person/day) ?
A) 121.1
B) 3.83
C) 2.96
D) 3.25
E) 104.4
Correct Answer:

Verified
Correct Answer:
Verified
Related Questions
Q6: At the grocery store,you are faced with
Q7: Collecting and counting the pieces of plastic
Q8: What are the characteristics of something that
Q9: Refer to Infographic 9.What options do consumers
Q10: Everyday garbage or trash (solid waste)produced by
Q12: The four Rs to help an individual
Q13: Composting kitchen and yard waste is an
Q14: To examine if microplastics (less than 5
Q15: It has been shown that a bottle
Q16: One of the cheapest and most common