Multiple Choice
Science Literacy Use the following graphs to answer the next questions. 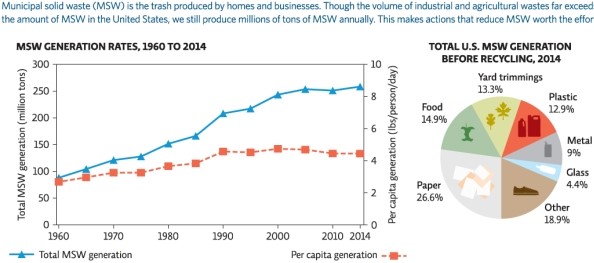
-In what year was per capita generation of municipal solid waste the greatest?
A) 2014
B) 1995
C) 1960
D) 1990
E) 2000
Correct Answer:

Verified
Correct Answer:
Verified
Related Questions
Q33: Why can't we permanently get rid of
Q34: A soup company wants to reduce the
Q35: We can reduce our ecological footprint by
Q36: When e-waste is improperly recycled,toxic metals can
Q37: Match the waste management method to its
Q39: Incinerators reduce the volume of solid waste
Q40: In the United States,91% to 97% of
Q41: Refer to Infographic 2.The pie chart shows
Q42: Which of the following statements about waste
Q43: What is the MOST appropriate way to