Multiple Choice
Science Literacy Use Infographic 7 below to answer the next questions: 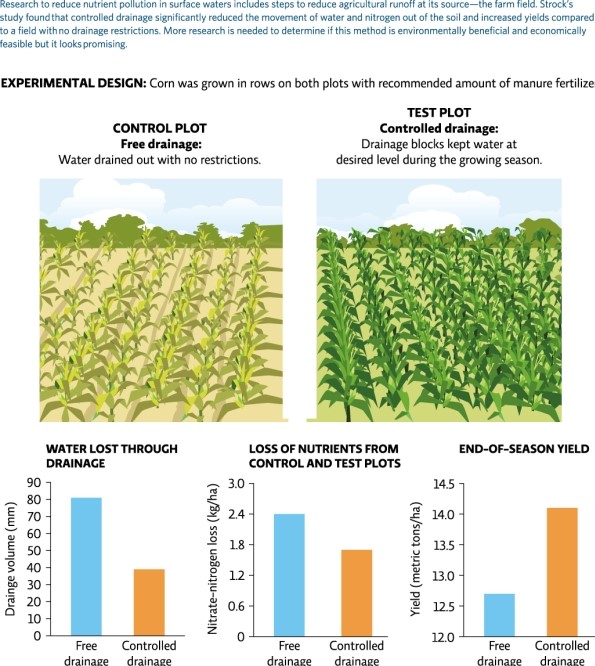
-What was the difference in nitrate-nitrogen loss when comparing control and test plots?
A) Control plots lost 0.6 kg/ha more than test plots.
B) Control plots lost 0.6 kg/ha less than test plots.
C) Test plots lost 0.6 kg/ha more than control plots.
D) Test plots lost 1.8 kg/ha less than control plots.
Correct Answer:

Verified
Correct Answer:
Verified
Q32: Which causes of water pollution are due
Q33: Which is NOT an aspect of the
Q34: Science Literacy Use Infographic 7 below to
Q35: What are performance standards?<br>A)excess levels of pollution
Q36: Science Literacy Use Infographic 7 below to
Q38: Why should we care about water pollution?
Q39: A watershed is _.<br>A)a storage facility for
Q40: The end result of eutrophication is _.<br>A)increased
Q41: What plant nutrients are found in animal
Q42: Which of the following would affect the