Multiple Choice
Refer to the graph depicting ocean acidification over time in Infographic 1.Which of the following statements is TRUE of the graph? 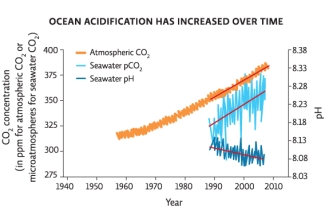
A) As the atmospheric concentration of CO2 increases,the amount of CO2 absorbed by the oceans (pCO2) also increases.
B) As the atmospheric concentration of CO2 increases,the amount of CO2 absorbed by the oceans (pCO2) decreases.
C) As the atmospheric concentration of CO2 increases,the seawater pH increases.
D) As the amount of CO2 absorbed by the oceans (pCO2) decreases,the seawater pH increases.
E) None of these answers is correct.
Correct Answer:

Verified
Correct Answer:
Verified
Q56: What is the pH trend in the
Q57: Coral bleaching is _.<br>A)when the sun bleaches
Q58: Examine the pH scale below.Which of the
Q59: Nutrient-rich areas where shallow rivers meet the
Q60: What are MPAs?<br>A)fishing areas for commercial fishermen<br>B)places
Q62: The greatest threat to coral reefs worldwide
Q63: Which of the following changes will have
Q64: What do organisms use to make shells?<br>A)Ca<sup>+2</sup><br>B)H<sub>2</sub>O<br>C)H<sup>+</sup><br>D)CO<sub>2</sub><br>E)CaCO<sub>3</sub>
Q65: What benefit do zooxanthellae get from their
Q66: What is ocean acidification? How are humans