Multiple Choice
Science Literacy Refer to the graphs below to answer the following questions. Below are data from a study (described in Module 6.3) conducted by Michael Lesser,Marc Slattery,and colleagues.The rate of photosynthesis (Graph A) and the amount of carbohydrate present (Graph B) ,an indication of photosynthetic production of sugars,were determined in sponges exposed to current temperature and pH (control) or to one of three test groups: the expected pH in 2100 (test group 1) ,the expected temperature in 2100 (test group 2) ,or both (test group 3) . (Note: Significant difference between groups is denoted by a different letter above the bars; if two groups share the same letter,they are not statistically different.) 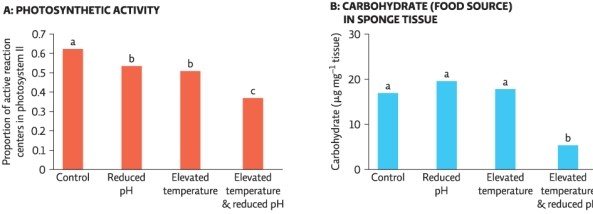
-Which groups in Graph A are not statistically different from each other?
A) the control group and the reduced pH group
B) the reduced pH group and the elevated temperature group
C) the elevated temperature group and the elevated temperature combined with reduced pH group
Correct Answer:

Verified
Correct Answer:
Verified
Q7: A young woman asks what the danger
Q8: Which of the following is NOT a
Q9: Threats from fishing pressure include _.<br>A)sediment pollution<br>B)plastic
Q10: Why do ecologists consider coral reefs a
Q11: The majority of coral reefs that have
Q13: Refer to Infographic 1.Carbon dioxide emissions have
Q14: Science Literacy Refer to the graphs below
Q15: The skeleton of coral is mostly composed
Q16: It is estimated that _ of all
Q17: Which strategy is INCORRECTLY matched with its