Multiple Choice
Science Literacy Refer to the graphs below to answer the following questions. Below are data from a study (described in Module 6.3) conducted by Michael Lesser,Marc Slattery,and colleagues.The rate of photosynthesis (Graph A) and the amount of carbohydrate present (Graph B) ,an indication of photosynthetic production of sugars,were determined in sponges exposed to current temperature and pH (control) or to one of three test groups: the expected pH in 2100 (test group 1) ,the expected temperature in 2100 (test group 2) ,or both (test group 3) . (Note: Significant difference between groups is denoted by a different letter above the bars; if two groups share the same letter,they are not statistically different.) 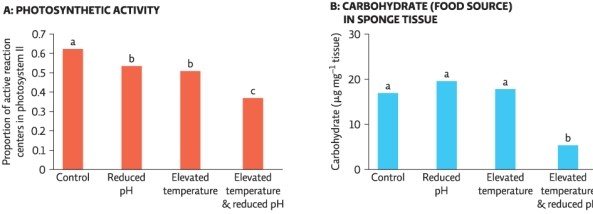
-What would the control conditions be for this experiment?
A) reduced pH
B) normal temperature and pH
C) elevated temperatures
D) both reduced pH and elevated temperatures
Correct Answer:

Verified
Correct Answer:
Verified
Q33: When a solution becomes acidic,it contains a
Q34: Which statement about coral reefs is FALSE?<br>A)Overfishing
Q35: Why is proximity to land an important
Q36: More than _ of today's oceans contain
Q37: The lowering of the pH of the
Q39: Refer to Infographic 3.Which ocean zone has
Q40: What is the major cause of ocean
Q41: The most well-documented effect of ocean acidification
Q42: Science Literacy Refer to the graphs below
Q43: Match the human activity to its correct